Output of the graphic
All figures of the mapping chains are drawn. The area is selected so that all figures are visible. However, the graph can be zoomed using the mouse wheel and moved by dragging with the left mouse button. Other options are described in Adjusting the graphics.
Use the button  , to copy he graph to the clipboard and paste it into a graphics program.
Before inserting a figure in the mapping list on the input page, you can select whether the construction lines should also be drawn in the corresponding diagram.
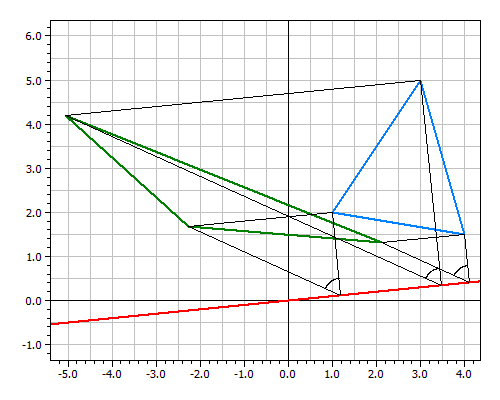
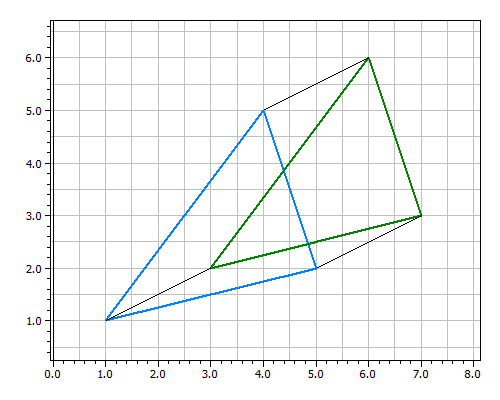
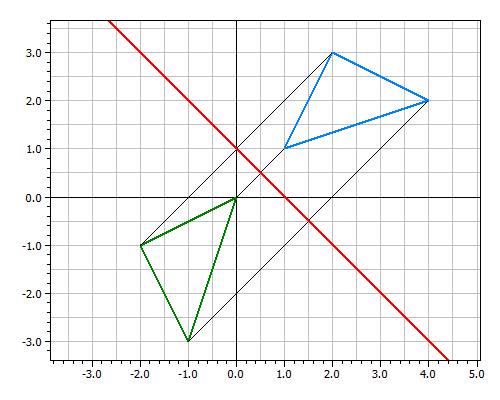
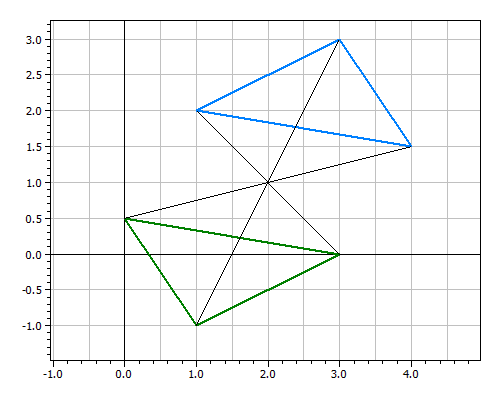
Examples with drawn construction lines:
Translation: dx=2, dy=1 ☑
Axial reflection: a=(PQ), P(1|0), Q(0|1) ☑
Point reflection: Z(2|1) ☑
Rotation: Z(2|-1), α=60° ☑
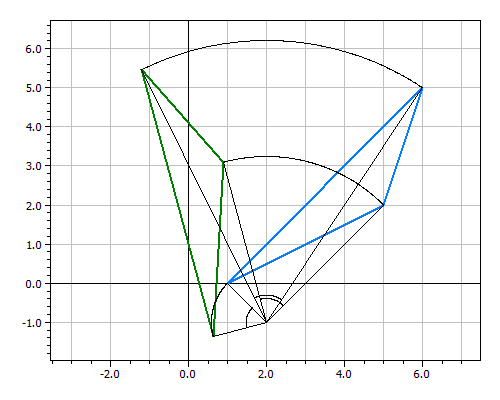
Homothetic transformation: Z(6|0), k=2 ☑
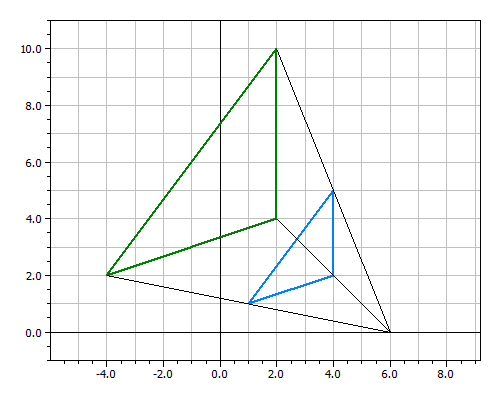
Shear transformation: a=(PQ), P(0|0), Q(10|1), α=60° ☑