

Setting the colors
- Basic setting in file/options
-
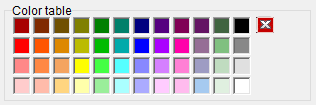
All 2D graphics, 3D graphics and charts use the colors from the following color table:
Twelve of them are specified together with twelve line widths as a basic setting in the File/Options section:
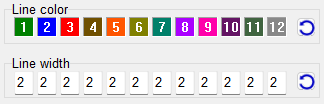
By clicking on one of the color panels you can replace the color with a new one from the color table. Clicking on the keys
 resets the colors and line widths back to their initial values.
The settings made here apply to the entire program, while the following Settings in 2D graphics only apply to the current program point.
- Setting in 2D graphics
-
The button
 on a graphic page opens the Settings window to set the colors and line widths of the current graphic in the Graphs tab.
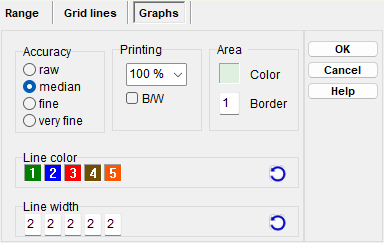
If you move the mouse pointer over one of the color panels, you will see which part of the graphic it belongs to. Some graphics contain colored areas, which can also be changed here.
A mouse click on the buttons resets the colors and line widths back to the default settings in the
File/Options item. If you click while holding down the Shift key, all colors and line widths are set to the value in the first field.NEW: If the Memory option is set, the colors and line widths are saved together with the input data and are available again the next time the program is started.
Tip: You can hide parts of the graphic by entering '0' as the line width. - Setting in 3D graphics
- The graphics in the Geometry 3D chapter and the Surface plot use the colors of the basic settings in the File/Options item and can be changed there if necessary.