

Surface plot
A surface function ƒ(x, y) is plotted, i.e. the three-dimensional diagram of a function with two variables. In many surface functions, terms are used several times; therefore it is possible to define a term u(x, y) separately and to use it as a u in the function term.
Examples:
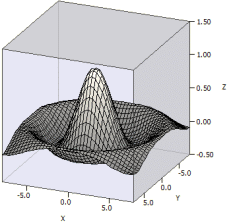
a) ƒ(x, y) = sin(u) / u
u(x, y) = sqr(x * x + y * y)
-8 ≤ x ≤ 8
-8 ≤ y ≤ 8;
-0,5 ≤ z ≤ 1,5
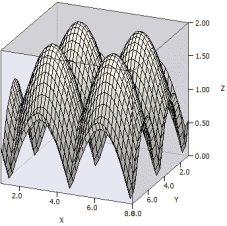
b) ƒ(x, y) = abs(sin (x)) + abs(cos (x))
1 ≤ x ≤ 8;
1 ≤ y ≤ 8;
0 ≤ z ≤ 2
See also:
Supported FunctionsSetting the graphics