

Example 2: Corona Pandemic
Of course, it makes sense to use the current data on the corona pandemic for logistic regression. I took the data for Germany from the Johns Hopkins University (JHU) website, which is updated daily, and saved it in CSV files.
Data from:  "JHU_DE_Mrz-Apr.csv"

Saturation limit:  56 Mio
      Dark figure:  1

                            4,559·1010
ƒ(x) = —————————————————
                 814,1 + 5,51·107 · e^(-0,112·t)

Inflection point W(99,4/28 Mio)

Maximum growth rate f'(xw) = 1,5688 Mio

60 Values
Coeff.of determin.   = 0,82574762
Correlation coeff.    = 0,90870656
Standard deviation = 0,90673232
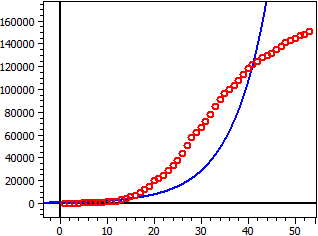
German data March-April 2020, S=56 Mio, Dark figur=1.
Data from: "JHU_DE_Mrz-Mai.csv"

Saturation limit: 56 Mio
         Dark figur: 300

                            2,5497·1013
ƒ(x) = ——————————————————
          4,553·105 + 5,5545·107 · e^(-0,10581·t)

Inflection point  W(45,404/28 Mio)

Maximum growth rate  ƒ'(xw) = 1,4813 Mio

92 Values
Coeff.of determin.   = 0,90140376
Correlation coeff.    = 0,94942285
Standard deviation = 0,93956073
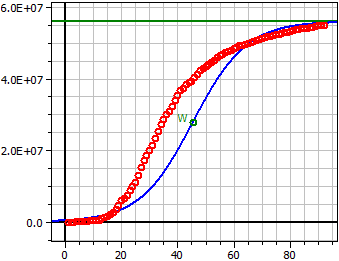
German data March-May 2020, S=56 Mio, Dark figur=300.
With large values, the scaling changes to the scientific number format. The following applies: 4.0E+07 = 4.0·107 = 40,000,000.
I assumed 56 million as the saturation limit. This is 70% of 80 million, the case of supposed herd immunity.