

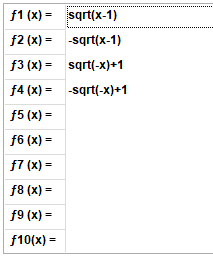
Function Plotter
Up to twelve functions can be plotted simultaneously in a coordinate system. You can also use combinations or derivatives of already defined functions.
Possible combinations:
If   ƒ1(x) = sin(x)  and  ƒ2(x) = 3*sqrt(x), then

ƒ3(x) = 2*y1^2-y2   substitudes    ƒ3(x) = 2*sin(x)^2-3*sqrt(x)
ƒ4(x) = f2(y1)         substitudes     ƒ4(x) = 3*sqrt(sin(x))
ƒ5(x) = y2'              substitudes     ƒ5(x) = 3/(2*sqrt(x))
The graph can be zoomed with the mouse wheel and moved as desired by dragging with the left mouse button. Other options are described under Adjusting the graphics.
Example:
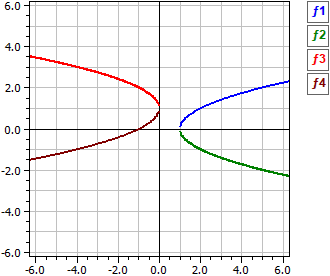
I chose this example because there have been a surprising number of inquiries as to why the lower half of the horizontal parabola
is not displayed for the root function.
This example shows that the lower half belongs to a different function.
The curves can be turned on and off individually with the switches on the right.
See also:
Supported FunctionsSetting the graphics