

Normal Distribution
For an
- density function 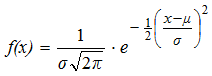
- and distribution function 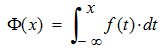
The graph of the density function ƒ(x) is often called a Gaussian or bell shaped curve. The distribution function Φ(x) is called the Gaussian error function, because, according to Gauss, this distribution is assumed for the random errors in astronomical observations.
The expected value μ and variance σ2 are entered. For μ=0 and σ=1 you receive the standardized normal distribution.
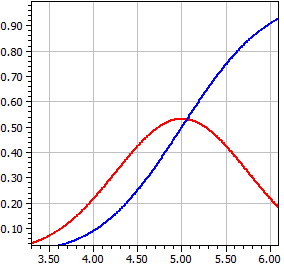
Example:
  μ = 5 ,      σ = .75

         x                     ƒ(x)                   Φ(x)
  —————       –—————     —————–
  2                       0,00017844      0,00003167
  2,33333333      0,00095649      0,00018859
  2,66666666      0,00420802      0,00093192
  2,99999999      0,01519465      0,00383038
  3,33333332      0,04503153      0,01313415
  3,66666665      0,10953585      0,03772017
  3,99999998      0,21868009      0,09121120
  4,33333331      0,35832381      0,18703139
  4,66666664      0,48189843      0,32836063
  4,99999997      0,53192304      0,49999998
  5,3333333        0,48189845      0,67163934
  5,66666663      0,35832383      0,81296859
  5,99999996      0,21868012      0,90878878
  6,33333329      0,10953586      0,96227982
See also:
Setting the graphicsWikipedia: Normal distribution