Binomial Distribution
For a b(k;n;p) distributed random variable X with fixed n and p you can compute
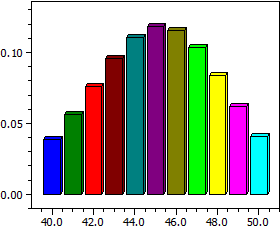
- a histogram of the probabilities P( X = k )
- a table of their values from kmin to kmax
- the probability P( kmin < X < kmax)
Theory:
n balls are randomly drawn from a container containing a proportion p of red balls. The random
variable X stands for the number of red balls drawn. The probability that k of the balls drawn are red,
is given by
The values for n and p are entered, where p must be between 0 and 1. Then a simple histogram gives a first overview
of the values of
Example:
  n = 60;    p = .75

     k           P(X=k)          P(0 ≤ X < k)
  ——    ——————   ——————
    40      0,03834033      0,09248427
    41      0,05610780      0,14859207
    42      0,07614630      0,22473838
    43      0,09562559      0,32036397
    44      0,11083875      0,43120273
    45      0,11822800      0,54943073
    46      0,11565783      0,66508856
    47      0,10335381      0,76844237
    48      0,08397497      0,85241733
    49      0,06169589      0,91411323
    50      0,04071929      0,95483252
  ——    ——————   ——————
  P(40 ≤ k < 50) =           0,90068858