

Regression
With this routine it is possible to perform a curve fitting for a series of measurements with a maximum of 1023 value pairs.
You can choose between the following types of regression and if necessary shift or stretch all points in x- or y-direction.
- Proportional Regression y = b·x
- Linear Regression y = a + b·x
- Polynomial Regression of n-th Order y = a0 + ... + an · xn
- Geometrical Regression y = a·xb
- Exponential Regression y = a·bx
- Logarithmic Regression y = a + b · ln(x)
The function term of the approximation curve, the coefficient of determination, the correlation coefficient and the standard deviation are output together with the graph. On the next page, these values are printed again, along with a table of the values of the function.
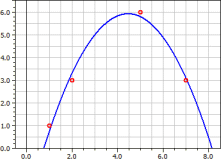
Example:
Curve through the points P1(1|1), P2(2|3), P3(5|6), P4(7|3).
Polynomial Regression

 y =  − 6,9152542
        + 4,7189266·x
        − 0,43361582·x2

Coeff.of determin.   = 0,98338318
Correlation coeff.    = 0,99165679
Standard deviation = 0,46028731
See also:
FormulasSetting the graphics